TL;DR
n8n expose metrics qua endpoint /metrics khi bật N8N_METRICS=true. Kết hợp Prometheus scrape mỗi 15 giây, Grafana visualize thành 8 dashboard, và alert rules tự động gửi cảnh báo Telegram khi workflow fail hoặc server quá tải. Bài này hướng dẫn toàn bộ stack từ Docker Compose đến alert rules, dựa trên kinh nghiệm chạy hơn 200 workflows production tại nextgrowth.ai. Nếu bạn đang tự host n8n là gì và cách tự host, đây là setup monitoring mình khuyến nghị nhất.
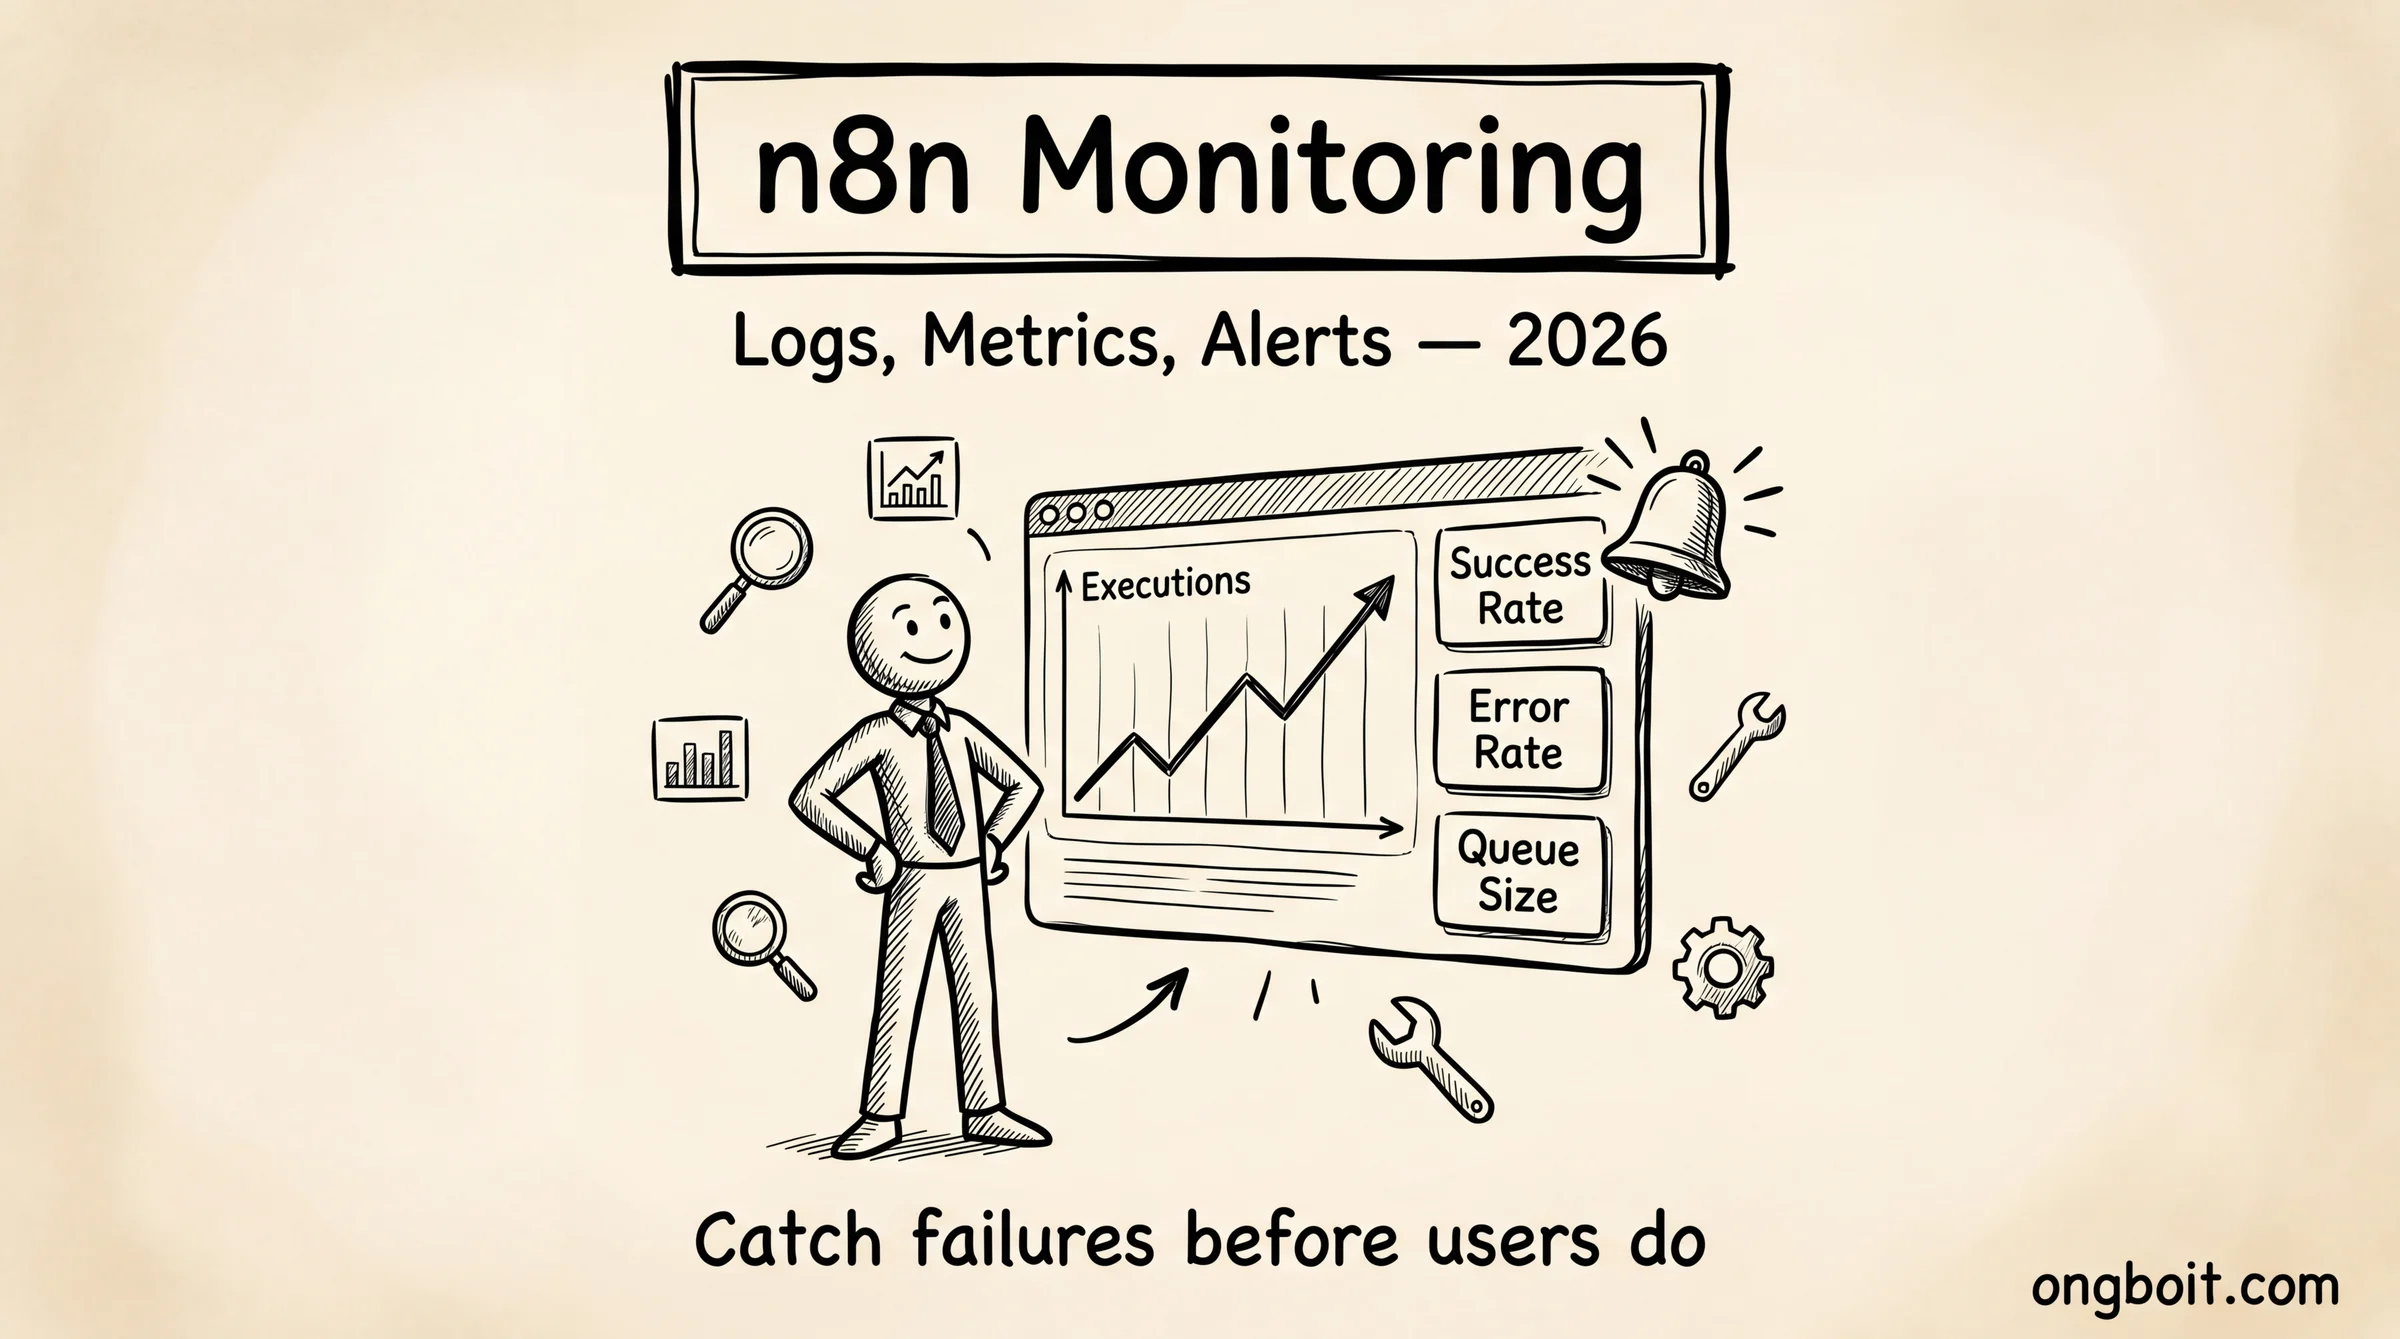
n8n Monitoring Là Gì? Tại Sao Bạn Cần?
Monitoring là cơ chế giúp bạn biết lỗi trước khi user báo. Thay vì ngồi chờ ai đó nhắn “ơi workflow bị lỗi rồi”, bạn nhận Telegram alert trong vòng 5 phút kể từ khi sự cố xảy ra.
Với n8n, monitoring chia thành hai lớp. Lớp thứ nhất là internal monitoring: n8n tự expose metrics qua HTTP endpoint, bao gồm số lần workflow chạy thành công, thất bại, thời gian xử lý, và trạng thái queue. Lớp thứ hai là external monitoring: các công cụ bên ngoài như Node Exporter theo dõi CPU, RAM, disk của server; cAdvisor theo dõi từng container Docker.
Monitoring Khác Logging Như Thế Nào?
Logging ghi lại những gì đã xảy ra, còn monitoring phát hiện pattern bất thường theo thời gian thực. Log giúp bạn debug sau sự cố; monitoring giúp bạn ngăn sự cố leo thang. Bộ đôi lý tưởng là dùng cả hai, nhưng nếu chỉ được chọn một, mình ưu tiên monitoring vì nó chủ động hơn.
Hậu Quả Khi Không Có Monitoring?
Mình từng chạy n8n không có monitoring gần 3 tháng. Hậu quả: một workflow gửi data lên Google Sheets bị silent fail do API quota hết, mình không biết cho đến khi check thủ công sau 2 tuần. Mất khoảng 300 records. Đau hơn là không có cách nào biết chính xác lỗi bắt đầu từ lúc nào.
Silent failures là mối nguy lớn nhất của automation. Workflow không crash, không có error message rõ ràng, chỉ đơn giản là không làm gì cả. Không có monitoring, bạn sẽ không biết điều này cho đến khi hậu quả đã xảy ra.
Cần Monitoring Những Gì? (Priority Checklist)
Câu trả lời nhanh: bắt đầu với workflow failures, sau đó thêm server health, rồi mới đến queue và database.
Không phải mọi thứ đều cần monitor từ đầu. Mình hay thấy người mới setup quá phức tạp rồi bị overwhelmed. Chiến lược đúng là ưu tiên theo tác động business: cái gì fail gây hậu quả lớn nhất thì monitor trước.
Workflow Failures (Ưu tiên Cao nhất)
Đây là lý do chính bạn cần monitoring. Theo dõi: tổng số execution, số execution fail, error rate theo %, thời gian trung bình mỗi execution. Nếu error rate vượt 5% trong 15 phút, cần alert ngay.
Server Health (Ưu tiên Cao)
CPU, RAM, disk space, network I/O. Quan trọng nhất là disk space vì n8n ghi execution history vào database, nếu disk đầy thì toàn bộ stack sập. Mình đặt alert ở 85% disk usage, tức là còn 15% thì cảnh báo.
Queue Depth (Queue Mode)
Nếu bạn đang chạy n8n Queue Mode, queue depth là metric quan trọng. Queue tăng mà không giảm là dấu hiệu worker đang overwhelmed hoặc đã crash. Alert khi queue depth tăng liên tục trong 10 phút.
Database Health
PostgreSQL là nơi n8n lưu toàn bộ workflow definitions và execution history. Theo dõi: connection count, slow queries, replication lag (nếu dùng replica). Postgres Exporter tự động collect các metrics này.
External API Uptime
Nhiều workflow phụ thuộc vào external APIs (Google Sheets, Slack, webhook endpoints). Bạn cần biết khi những services này down để tránh blame n8n oan.
Tools Nào Dùng Cho n8n Monitoring?
Stack mình khuyến nghị là Prometheus + Grafana, hoàn toàn miễn phí và self-hosted. Đây là combination tiêu chuẩn của DevOps community, documentation đầy đủ, và tích hợp tốt với Docker.

So sánh nhanh với alternatives: Datadog mạnh hơn nhưng tốn tiền (~$15/host/tháng, Datadog Pricing, truy cập 01/07/2026), phù hợp team có budget. Zabbix thì free nhưng config phức tạp hơn nhiều, UI cũ. New Relic có free tier nhưng limited retention. Với VPS self-host, Prometheus + Grafana là lựa chọn cost-effective nhất, và cũng là stack được DevOps community dùng nhiều nhất.
Tại sao chọn Prometheus + Grafana mà không dùng Datadog hay New Relic? Đơn giản: miễn phí và self-host. Datadog tính phí theo host ($15-23/host/tháng, Datadog Pricing, truy cập 01/07/2026), với 3-4 containers cho n8n stack bạn tốn thêm $60-90/tháng chỉ cho monitoring. Prometheus + Grafana chạy trên cùng VPS, thêm ~500MB RAM, chi phí thêm: $0.
Zabbix cũng là lựa chọn tốt nhưng setup phức tạp hơn nhiều và UI không đẹp bằng Grafana. Mình đã dùng Zabbix ở công ty cũ, giờ chuyển sang Prometheus stack vì nhẹ hơn và cộng đồng support tốt hơn cho container monitoring.
Setup Prometheus + Grafana Bằng Docker Compose Như Thế Nào?
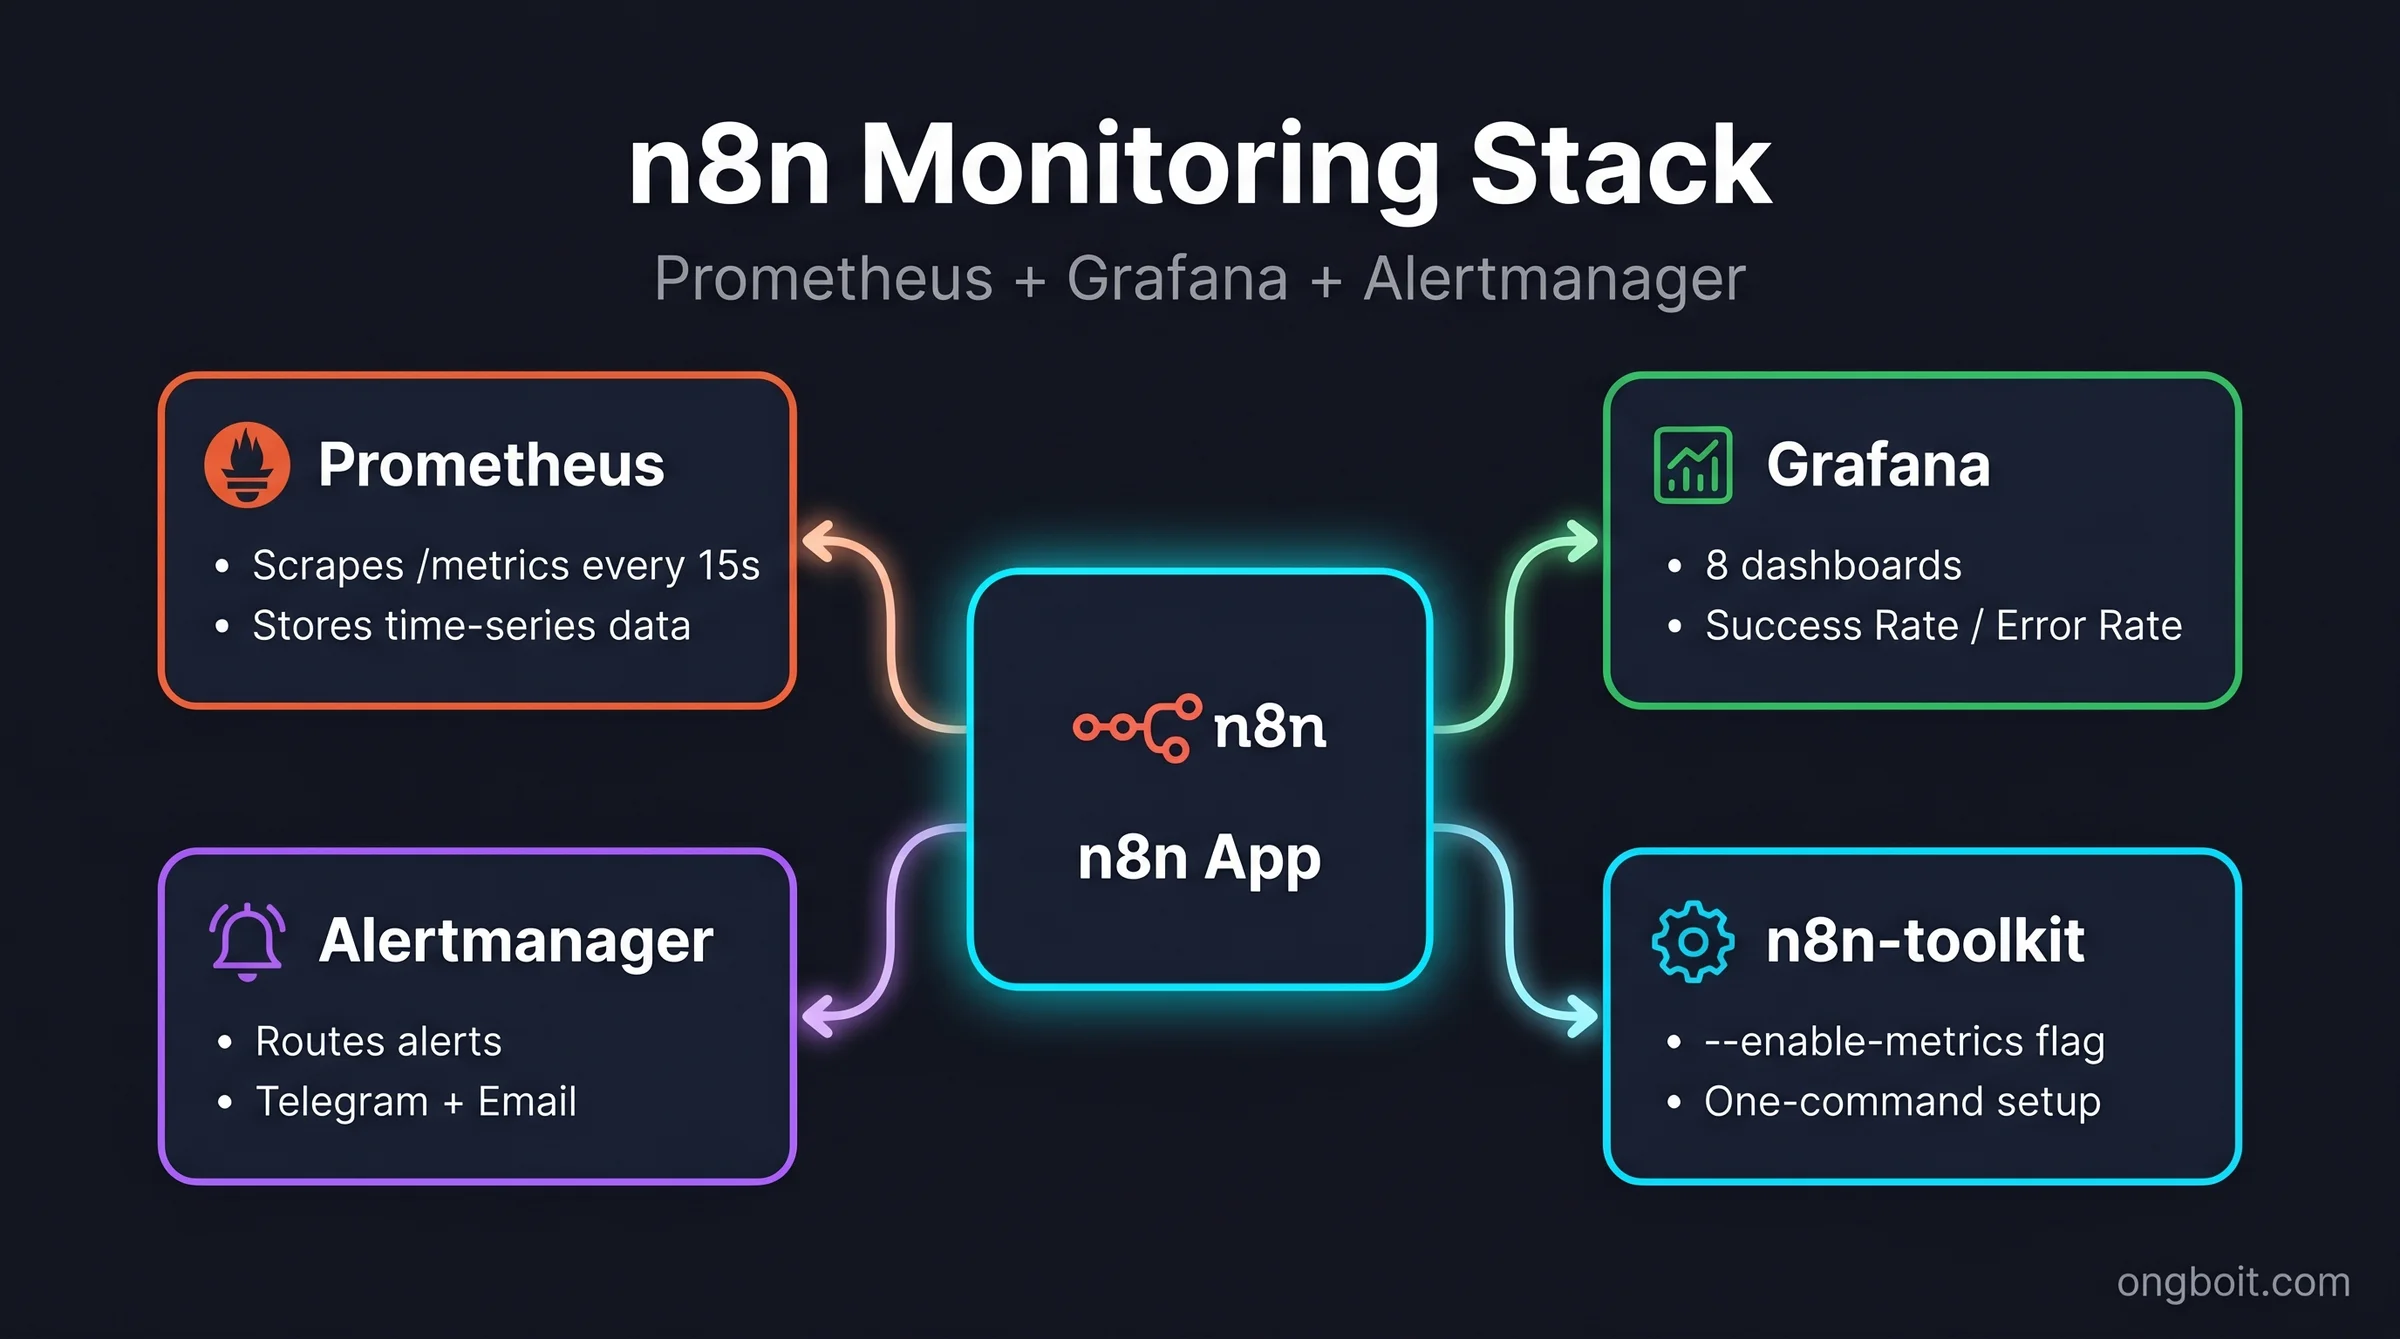
Mình sẽ hướng dẫn setup toàn bộ từ Docker Compose đến verify. Bài này sử dụng Docker Compose profiles để monitoring stack là optional, tức là bạn có thể bật/tắt độc lập mà không ảnh hưởng n8n chính.
Nếu bạn đang deploy n8n trên Coolify để self-host n8n, bạn vẫn có thể chạy monitoring stack riêng với Docker Compose trực tiếp trên VPS.
Kiến Trúc Tổng Quan
┌─────────────────────────────────────────────────────┐
│                     VPS Host                        │
│                                                     │
│  ┌──────────┐    ┌────────────┐    ┌─────────────┐  │
│  │   n8n    │───▶│ Prometheus │───▶│   Grafana   │  │
│  │ :5678    │    │  :9090     │    │   :3000     │  │
│  └──────────┘    └────────────┘    └─────────────┘  │
│       │               ▲                   │         │
│  ┌────┴─────┐    ┌────┴──────────────┐    │         │
│  │PostgreSQL│    │ Node Exporter      │    ▼         │
│  │ :5432    │    │ cAdvisor           │  Alert       │
│  │Postgres  │    │ Redis Exporter     │  Telegram    │
│  │Exporter  │    │ Postgres Exporter  │             │
│  └──────────┘    └────────────────────┘             │
└─────────────────────────────────────────────────────┘
File Docker Compose Đầy Đủ
Tạo file docker-compose.monitoring.yml (hoặc thêm vào docker-compose.yml hiện có với profiles):
version: "3.8"

services:
  # ─── Core n8n Stack ──────────────────────────────
  postgres:
    image: postgres:16-alpine
    restart: unless-stopped
    environment:
      POSTGRES_USER: ${POSTGRES_USER:-n8n}
      POSTGRES_PASSWORD: ${POSTGRES_PASSWORD}
      POSTGRES_DB: ${POSTGRES_DB:-n8n}
    volumes:
      - postgres_data:/var/lib/postgresql/data
    healthcheck:
      test: ["CMD-SHELL", "pg_isready -U ${POSTGRES_USER:-n8n}"]
      interval: 10s
      timeout: 5s
      retries: 5

  n8n:
    image: n8nio/n8n:latest
    restart: unless-stopped
    ports:
      - "5678:5678"
    environment:
      # Database
      DB_TYPE: postgresdb
      DB_POSTGRESDB_HOST: postgres
      DB_POSTGRESDB_PORT: 5432
      DB_POSTGRESDB_DATABASE: ${POSTGRES_DB:-n8n}
      DB_POSTGRESDB_USER: ${POSTGRES_USER:-n8n}
      DB_POSTGRESDB_PASSWORD: ${POSTGRES_PASSWORD}
      # Metrics, QUAN TRỌNG: bật để Prometheus scrape được
      N8N_METRICS: "true"
      N8N_METRICS_PREFIX: "n8n_"
      N8N_METRICS_INCLUDE_WORKFLOW_ID_LABEL: "true"
      N8N_METRICS_INCLUDE_NODE_TYPE_LABEL: "true"
      N8N_METRICS_INCLUDE_CREDENTIAL_TYPE_LABEL: "false"
      # General
      N8N_HOST: ${N8N_HOST:-localhost}
      N8N_PORT: 5678
      WEBHOOK_URL: ${WEBHOOK_URL}
      N8N_ENCRYPTION_KEY: ${N8N_ENCRYPTION_KEY}
    volumes:
      - n8n_data:/home/node/.n8n
    depends_on:
      postgres:
        condition: service_healthy

  # ─── Monitoring Stack (profile: monitoring) ──────
  prometheus:
    image: prom/prometheus:latest
    restart: unless-stopped
    profiles: ["monitoring"]
    ports:
      - "9090:9090"
    command:
      - "--config.file=/etc/prometheus/prometheus.yml"
      - "--storage.tsdb.path=/prometheus"
      - "--storage.tsdb.retention.time=${PROMETHEUS_RETENTION:-15d}"
      - "--web.enable-lifecycle"
      - "--web.enable-admin-api"
    volumes:
      - ./monitoring/prometheus:/etc/prometheus
      - prometheus_data:/prometheus
    depends_on:
      - n8n

  grafana:
    image: grafana/grafana:latest
    restart: unless-stopped
    profiles: ["monitoring"]
    ports:
      - "3000:3000"
    environment:
      GF_SECURITY_ADMIN_USER: ${GRAFANA_ADMIN_USER:-admin}
      GF_SECURITY_ADMIN_PASSWORD: ${GRAFANA_ADMIN_PASSWORD}
      GF_USERS_ALLOW_SIGN_UP: "false"
      GF_INSTALL_PLUGINS: grafana-piechart-panel
    volumes:
      - grafana_data:/var/lib/grafana
      - ./monitoring/grafana/provisioning:/etc/grafana/provisioning
      - ./monitoring/grafana/dashboards:/var/lib/grafana/dashboards
    depends_on:
      - prometheus

  node-exporter:
    image: prom/node-exporter:latest
    restart: unless-stopped
    profiles: ["monitoring"]
    pid: host
    command:
      - "--path.rootfs=/host"
      - "--collector.filesystem.mount-points-exclude=^/(sys|proc|dev|host|etc)($$|/)"
    volumes:
      - /:/host:ro,rslave
    network_mode: host

  cadvisor:
    image: gcr.io/cadvisor/cadvisor:latest
    restart: unless-stopped
    profiles: ["monitoring"]
    privileged: true
    devices:
      - /dev/kmsg:/dev/kmsg
    volumes:
      - /:/rootfs:ro
      - /var/run:/var/run:ro
      - /sys:/sys:ro
      - /var/lib/docker:/var/lib/docker:ro
      - /cgroup:/cgroup:ro
    ports:
      - "8080:8080"

  postgres-exporter:
    image: prometheuscommunity/postgres-exporter:latest
    restart: unless-stopped
    profiles: ["monitoring"]
    environment:
      DATA_SOURCE_NAME: "postgresql://${POSTGRES_USER:-n8n}:${POSTGRES_PASSWORD}@postgres:5432/${POSTGRES_DB:-n8n}?sslmode=disable"
    depends_on:
      - postgres

volumes:
  postgres_data:
  n8n_data:
  prometheus_data:
  grafana_data:
Prometheus Config
Tạo file monitoring/prometheus/prometheus.yml:
global:
  scrape_interval: 15s
  evaluation_interval: 15s
  external_labels:
    environment: 'production'
    site: 'n8n-server'

rule_files:
  - "alert_rules.yml"

alerting:
  alertmanagers:
    - static_configs:
        - targets: ['alertmanager:9093']

scrape_configs:
  - job_name: 'n8n'
    static_configs:
      - targets: ['n8n:5678']
    metrics_path: '/metrics'
    scrape_interval: 15s

  - job_name: 'node-exporter'
    static_configs:
      - targets: ['localhost:9100']

  - job_name: 'cadvisor'
    static_configs:
      - targets: ['cadvisor:8080']

  - job_name: 'postgres-exporter'
    static_configs:
      - targets: ['postgres-exporter:9187']

  - job_name: 'prometheus'
    static_configs:
      - targets: ['localhost:9090']
File .env
# PostgreSQL
POSTGRES_USER=n8n
POSTGRES_PASSWORD=your_strong_password_here
POSTGRES_DB=n8n

# n8n
N8N_HOST=your-domain.com
WEBHOOK_URL=https://your-domain.com/
N8N_ENCRYPTION_KEY=your_32_char_encryption_key

# Monitoring
PROMETHEUS_RETENTION=15d
GRAFANA_ADMIN_USER=admin
GRAFANA_ADMIN_PASSWORD=your_grafana_password

# Telegram Alerts
TELEGRAM_BOT_TOKEN=your_bot_token
TELEGRAM_CHAT_ID=your_chat_id
Khởi Động và Verify
# Chạy n8n core (không có monitoring)
docker compose up -d

# Bật monitoring stack
docker compose --profile monitoring up -d

# Kiểm tra n8n expose metrics
curl http://localhost:5678/metrics | grep n8n_

# Kiểm tra Prometheus đang scrape
curl http://localhost:9090/api/v1/targets | python3 -m json.tool

# Truy cập Grafana
open http://localhost:3000  # login: admin / your_grafana_password
ssh -L 3000:localhost:3000 user@your-server).
8 Dashboard Grafana Bạn Cần Có?
Sau khi Grafana chạy, bước tiếp theo là import dashboards. Thay vì tự tạo từ đầu, mình dùng pre-built dashboards từ cộng đồng và customize lại. Tám dashboard dưới đây cover toàn bộ stack n8n từ application đến infrastructure.

Import dashboard qua Grafana UI: Dashboards → Import → nhập ID → Load. Chọn Prometheus làm data source. Hai dashboard số 1 và 2 (n8n specific) bạn cần tự tạo hoặc lấy từ nextgrowth.ai.
Cách Đọc Dashboard Trong 30 Giây
Mình có thói quen scan dashboard theo thứ tự: đầu tiên xem error rate (nếu >0% là cần chú ý), sau đó xem RAM trend trong 24h (nếu tăng dần mà không giảm là memory leak), cuối cùng xem disk space còn lại. Ba metrics này đủ để biết hệ thống đang ổn hay không trong 30 giây.
Ba Câu Hỏi Khi Xem Dashboard
Trước khi panic khi thấy metric tăng cao, hãy tự hỏi: (1) Metric này có bình thường trong context hiện tại không? CPU 80% lúc batch job chạy là bình thường. (2) Trend đang đi hướng nào, tăng hay giảm? (3) Metric này có ảnh hưởng user không, hay chỉ là background spike?
Alert Rules: Cảnh Báo Tự Động Qua Telegram Như Thế Nào?
Alert là phần quan trọng nhất của monitoring. Dashboard đẹp đến đâu cũng vô nghĩa nếu bạn không xem. Alert rules chạy liên tục và chủ động báo bạn khi có vấn đề.
Tạo file monitoring/prometheus/alert_rules.yml:
Category 1: Instance Health (5 Rules)
groups:
  - name: n8n_instance_health
    interval: 30s
    rules:
      # Rule 1: n8n health endpoint down
      - alert: N8nDown
        expr: up{job="n8n"} == 0
        for: 1m
        labels:
          severity: critical
          category: instance
        annotations:
          summary: "n8n instance đang down"
          description: "n8n tại {{ $labels.instance }} không phản hồi hơn 1 phút. Kiểm tra container ngay."

      # Rule 2: High memory usage
      - alert: HighMemoryUsage
        expr: |
          (node_memory_MemTotal_bytes - node_memory_MemAvailable_bytes)
          / node_memory_MemTotal_bytes * 100 > 80
        for: 5m
        labels:
          severity: warning
          category: instance
        annotations:
          summary: "RAM usage vượt 80%"
          description: "Server đang dùng {{ $value | printf "%.1f" }}% RAM. Xem xét tắt bớt service hoặc nâng cấp VPS."

      # Rule 3: Disk space critical
      - alert: DiskSpaceCritical
        expr: |
          (node_filesystem_avail_bytes{fstype!="tmpfs",mountpoint="/"}
          / node_filesystem_size_bytes{fstype!="tmpfs",mountpoint="/"}) * 100 < 15
        for: 5m
        labels:
          severity: critical
          category: instance
        annotations:
          summary: "Disk space còn dưới 15%"
          description: "Volume / còn {{ $value | printf "%.1f" }}% dung lượng trống. Cần dọn dẹp ngay để tránh n8n crash."

      # Rule 4: High CPU sustained
      - alert: HighCPUSustained
        expr: |
          100 - (avg by (instance) (rate(node_cpu_seconds_total{mode="idle"}[5m])) * 100) > 90
        for: 10m
        labels:
          severity: warning
          category: instance
        annotations:
          summary: "CPU vượt 90% trong 10 phút"
          description: "CPU đang ở {{ $value | printf "%.1f" }}%. Có thể có workflow đang loop hoặc process zombie."

      # Rule 5: Workflow execution failure rate cao
      - alert: WorkflowFailureRateHigh
        expr: |
          rate(n8n_workflow_failed_total[15m])
          / (rate(n8n_workflow_success_total[15m]) + rate(n8n_workflow_failed_total[15m])) * 100 > 5
        for: 15m
        labels:
          severity: warning
          category: workflow
        annotations:
          summary: "Tỷ lệ workflow fail vượt 5%"
          description: "{{ $value | printf "%.1f" }}% workflows đang fail trong 15 phút qua. Kiểm tra n8n execution logs."
Category 2: Queue Mode (5 Rules)
  - name: n8n_queue_mode
    interval: 30s
    rules:
      # Rule 6: Queue depth tăng liên tục
      - alert: QueueDepthGrowing
        expr: |
          increase(redis_list_length{key="bull:jobs:wait"}[10m]) > 0
          and redis_list_length{key="bull:jobs:wait"} > 10
        for: 10m
        labels:
          severity: warning
          category: queue
        annotations:
          summary: "Queue đang tăng không ngừng"
          description: "Queue hiện có {{ $value }} jobs đang chờ và đang tăng. Worker có thể đã crash hoặc overwhelmed."

      # Rule 7: No active workers
      - alert: NoActiveWorkers
        expr: n8n_queue_workers_active_count == 0
        for: 2m
        labels:
          severity: critical
          category: queue
        annotations:
          summary: "Không có worker nào đang hoạt động"
          description: "Queue Mode đang chạy nhưng không có worker active. Tất cả jobs sẽ bị stuck."

      # Rule 8: Job waiting too long
      - alert: JobWaitingTooLong
        expr: n8n_queue_jobs_waiting_duration_seconds > 300
        for: 5m
        labels:
          severity: warning
          category: queue
        annotations:
          summary: "Jobs đang chờ hơn 5 phút"
          description: "Jobs trong queue đang phải chờ {{ $value | humanizeDuration }}. Worker đang bị bottleneck."

      # Rule 9: Redis memory usage cao
      - alert: RedisMemoryHigh
        expr: redis_memory_used_bytes / redis_memory_max_bytes * 100 > 80
        for: 5m
        labels:
          severity: warning
          category: queue
        annotations:
          summary: "Redis memory vượt 80%"
          description: "Redis đang dùng {{ $value | printf "%.1f" }}% max memory. Nguy cơ eviction keys."

      # Rule 10: PostgreSQL connections saturation
      - alert: PostgresConnectionSaturation
        expr: |
          pg_stat_activity_count / pg_settings_max_connections * 100 > 80
        for: 5m
        labels:
          severity: warning
          category: database
        annotations:
          summary: "PostgreSQL connections vượt 80%"
          description: "{{ $value | printf "%.1f" }}% connections đã được dùng. Xem xét tăng max_connections hoặc dùng PgBouncer."
Setup Telegram Bot Alert
Grafana gửi alert qua nhiều channel, nhưng mình thích Telegram nhất vì notifications rõ ràng và không bị spam như email.
Bước 1: Tạo bot Telegram qua @BotFather, lấy token.
Bước 2: Lấy Chat ID của bạn bằng cách nhắn tin cho bot, sau đó truy cập:
https://api.telegram.org/bot{YOUR_BOT_TOKEN}/getUpdates
Bước 3: Trong Grafana, vào Alerting → Contact points → Add contact point. Chọn type Telegram, điền Bot API Token và Chat ID.
Bước 4: Tạo Notification Policy: Alerting → Notification policies → Add nested policy. Set label matcher là severity=critical route đến Telegram. Test bằng nút “Send test notification”.
Alert fatigue là vấn đề thực sự. Lúc đầu mình setup alert cho mọi thứ: mỗi workflow fail, mỗi CPU spike 1 phút, mỗi Redis latency tăng. Kết quả: 50+ alerts/ngày, mình bắt đầu ignore tất cả. Giờ mình chỉ alert cho: execution failure rate > 10% trong 5 phút, memory > 85% trong 10 phút, và disk > 90%. Ba rules này cover 95% sự cố nghiêm trọng mà không spam.
Đừng quên test alert rules. Mình có thói quen mỗi tháng tạo 1 workflow test cố ý fail để verify alert pipeline vẫn hoạt động. Nhiều lần phát hiện Telegram bot token hết hạn mà không biết, tức là cả tháng qua alert không gửi được.
Single Mode vs Queue Mode: Monitoring Khác Gì Nhau?
Câu hỏi mình hay được hỏi: “mình đang chạy Single Mode, có cần setup monitoring phức tạp vậy không?” Câu trả lời là: bắt đầu với Single Mode monitoring (đơn giản hơn), chuyển sang Queue Mode monitoring khi cần scale.

Nếu bạn chưa setup Queue Mode, bài viết về n8n Queue Mode giải thích khi nào cần chuyển và cách setup từ đầu. Tóm tắt: Single Mode đủ cho <50 workflows chạy không đồng thời, Queue Mode cần thiết khi bạn có nhiều webhook triggers hoặc cần parallel processing.
Mình hay bắt đầu ngày làm việc bằng cách mở Grafana dashboard n8n Essentials. Chỉ mất 30 giây để scan: execution success rate có ổn không, queue depth có tăng bất thường không, memory usage còn bao nhiêu. Nếu tất cả xanh, yên tâm làm việc. Nếu có đỏ, biết ngay chỗ cần check.
Cách đọc dashboard hiệu quả nhất mình học được: đừng cố hiểu mọi metric cùng lúc. Tập trung vào 3 câu hỏi: Hệ thống có đang healthy không? Có workflow nào fail không? Resources có đủ cho workload hiện tại không? Ba câu hỏi này cover 90% vấn đề bạn sẽ gặp.
Một tip thực tế: set Grafana dashboard làm trang mở đầu trên browser. Mỗi sáng mở laptop, thứ đầu tiên bạn thấy là health status của n8n stack. Không cần nhớ check, nó tự nhắc bạn.
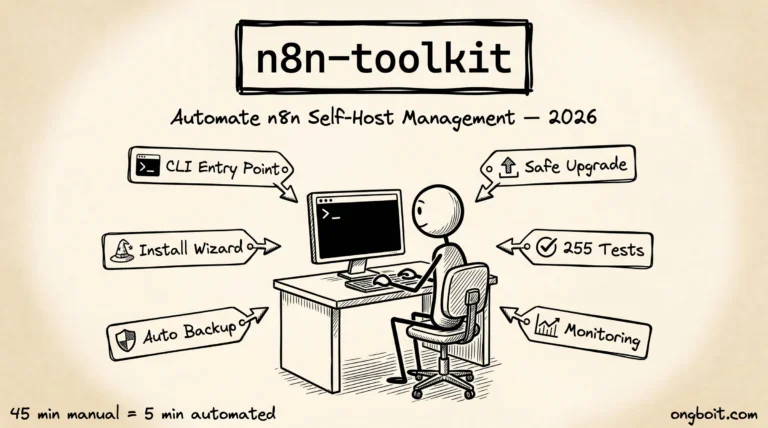
Dùng n8n-toolkit? Bật Monitoring Bằng 1 Flag
Nếu bạn dùng n8n-toolkit để quản lý n8n, bạn không cần chạy Docker Compose riêng cho monitoring stack. Chỉ cần flag --monitoring khi install:
# Bật monitoring ngay khi install
sudo ./n8n_manager.sh --install domain.com --monitoring

# Hoặc enable sau khi đã cài
sudo ./n8n_manager.sh --enable-monitoring
Toolkit tự copy deploy/monitoring/ (Prometheus config + Grafana dashboards có sẵn), set COMPOSE_PROFILES=monitoring trong .env, và khởi động đầy đủ stack, bao gồm tất cả các exporters mình đã mô tả ở trên.
3 metrics quan trọng nhất để đọc Grafana dashboard đúng cách:
- Event Loop Lag: 3-4ms = bình thường, >100ms liên tục = n8n process quá tải, cần scale hoặc tối ưu workflow phức tạp
- RSS Memory: tăng liên tục không bao giờ giảm = memory leak, cần restart container và điều tra workflow nào đang giữ bộ nhớ
- Queue Backlog: số jobs đang chờ trong Redis; >50 lâu dài = worker đang quá tải, cần thêm worker instance
Monitoring Trong Bối Cảnh Ecosystem n8n 2026 Có Vai Trò Gì?
Phần này đặt monitoring trong bối cảnh tổng thể của hệ sinh thái n8n năm 2026, giúp đội nhóm hiểu rõ vị trí và tầm quan trọng của việc giám sát trong toàn bộ quy trình vận hành sản phẩm tự động hóa. Monitoring không phải là tác vụ độc lập mà phải tích hợp chặt chẽ với các thành phần khác trong stack công nghệ của doanh nghiệp.
Một, Liên Kết Với Pricing Strategy
Dữ liệu monitoring trực tiếp ảnh hưởng đến quyết định chọn gói cho dự án. Theo dõi sát sao số lượng workflow execution mỗi ngày giúp đội nhóm dự đoán chính xác chi phí trên gói n8n Cloud pricing, tránh tình trạng cuối tháng nhận hóa đơn cao gấp đôi dự kiến do không kiểm soát được volume thực tế. Monitoring cũng giúp phát hiện sớm các workflow chạy quá nhiều không cần thiết, ví dụ polling trigger thay vì webhook trigger, để tối ưu trước khi chi phí tích lũy quá lớn.
Hai, Bổ Trợ Cho AI Agent Workflow
Khi triển khai n8n AI Agent workflow, monitoring trở nên đặc biệt quan trọng vì chi phí token AI có thể tăng nhanh chóng nếu không kiểm soát chặt. Dashboard Grafana riêng cho AI workflow nên hiển thị số token tiêu thụ mỗi ngày, chi phí tích lũy theo tuần, và tỉ lệ thành công của các AI call. Cảnh báo gửi đến Slack hoặc Telegram khi chi phí AI vượt ngưỡng định trước giúp đội ngũ phản ứng nhanh trước khi vấn đề leo thang thành sự cố tài chính nghiêm trọng.
Ba, Tích Hợp Với Claude Code Workflow
Pattern tích hợp với Claude Code qua MCP server cần monitoring kỹ hơn các pattern thông thường vì có thêm layer Claude API call có thể fail riêng biệt với workflow native. Dashboard nên tách biệt metric của Claude API (latency, error rate, token usage) với metric của workflow n8n thuần (execution count, duration). Cách phân tách này giúp xác định nhanh chóng vấn đề nằm ở đâu khi pipeline gặp sự cố, tiết kiệm hàng giờ debug khi có incident xảy ra trong môi trường sản xuất.
Bốn, Tối Ưu Cho Self-Host Trên Coolify
Phần lớn team VN đang dùng Coolify để self-host n8n, monitoring cần được config phù hợp với môi trường này. Coolify cung cấp dashboard cơ bản về CPU, RAM, và network của container, nhưng cần bổ sung Prometheus + Grafana riêng cho việc track metric chi tiết của workflow n8n. Pattern khôn ngoan là chạy stack monitoring trên cùng VPS với n8n để giảm chi phí và đơn giản hóa quản lý, miễn là VPS có đủ resource cho cả 2 component chạy song song.
Bài Học Vận Hành Monitoring Sau 1 Năm Tại ongboit.com
3 bài học thực chiến từ 1 năm vận hành monitoring cho n8n tại ongboit.com và khách hàng:
Bài Học 1: Đừng Tin Alert Rule Mặc Định
Alert rule mặc định của Prometheus thường quá nhạy hoặc quá ít nhạy cho từng môi trường cụ thể. Trong tháng đầu vận hành, mình nhận trung bình 20-30 alert mỗi ngày, hầu hết là false positive khiến team mất niềm tin vào hệ thống. Sau khi tune threshold dựa trên data thực tế, số alert giảm xuống còn 3-5 mỗi tuần và tất cả đều là real issue cần xử lý. Đầu tư 2-3 tuần tune alert rule là khoản đầu tư xứng đáng cho mọi team triển khai monitoring lần đầu.
Bài Học 2: Dashboard Đẹp Chưa Chắc Tốt
Người mới thường thiết kế dashboard rất đẹp với nhiều chart màu sắc, nhưng dashboard tốt là dashboard giúp ra decision nhanh khi có incident. Pattern khôn ngoan là thiết kế theo information hierarchy: dashboard overview chỉ hiển thị 4-5 metric quan trọng nhất, dashboard chi tiết chỉ mở khi cần investigate sâu hơn. Quy tắc DevOps experienced: nếu dashboard cần >5 giây để đọc và hiểu, cần redesign đơn giản hơn.
Bài Học 3: Backup Monitoring Stack Quan Trọng Như Backup Workflow
Sai lầm phổ biến là chỉ backup data n8n mà quên backup config Prometheus + Grafana. Khi VPS gặp incident cần restore, team phải tự config lại toàn bộ dashboard và alert rule từ đầu, mất hàng chục giờ không cần thiết. Pattern bảo vệ tốt nhất là lưu toàn bộ config dưới dạng Infrastructure as Code (Terraform hoặc Ansible) để có thể tái tạo nhanh môi trường monitoring khi cần. Đầu tư 1-2 ngày setup IaC ban đầu tiết kiệm hàng tuần khi incident nghiêm trọng xảy ra.
3 nuance bổ sung từ thực tế vận hành dài hạn:
- Executive dashboard riêng cho non-tech audience. Dashboard kỹ thuật khó hiểu với leadership và khách hàng doanh nghiệp. Build thêm 1 high-level dashboard chỉ hiển thị 3-4 KPI business (workflow success rate, daily order processed, monthly ops cost), giúp họ hiểu rõ giá trị automation mang lại mà không phải đào sâu chi tiết technical.
- Downsampling để tối ưu storage cost. Lưu metric high-resolution dài hạn rất tốn disk. Dùng Prometheus auto downsampling: detail-second cho 7 ngày, per-minute cho 1 tháng, per-hour cho 1 năm. Cho retention >1 năm, cân nhắc Thanos hoặc Mimir để export metric sang cheap object storage.
- Document hệ thống monitoring. Nhiều team setup nhiều dashboard và alert rule nhưng không có docs giải thích metric nghĩa gì, threshold chọn dựa trên cơ sở nào, runbook khi alert fire. Khi key personnel rời team hoặc team scale, docs này trở thành tài sản quý. Pattern khuyến nghị: viết 1 page tổng hợp trong Notion hoặc Confluence riêng cho monitoring stack, update khi có thay đổi quan trọng.
Câu Hỏi Thường Gặp
n8n có built-in monitoring không?
n8n có built-in execution history và logs trong UI, nhưng không có real-time monitoring hay alerting. Bạn có thể xem workflow runs đã pass/fail trong phần “Executions”, nhưng không có alert, không có trend analysis, không có server metrics. Đó là lý do cần thêm Prometheus + Grafana bên ngoài. n8n expose metrics qua endpoint /metrics (khi bật N8N_METRICS=true) để Prometheus có thể scrape, nhưng phần visualize và alert thì n8n không xử lý.
Prometheus + Grafana có miễn phí không?
Cả hai đều open source và miễn phí. Prometheus (Apache 2.0 license) và Grafana OSS (AGPL-3.0) là free hoàn toàn. Grafana Cloud có free tier với 10.000 metrics, 50GB logs (Grafana Pricing, truy cập 01/07/2026), phù hợp nếu bạn không muốn self-host. Grafana Enterprise thì có phí, nhưng cho n8n monitoring thì Grafana OSS là đủ dùng.
Cần bao nhiêu RAM cho monitoring stack?
Stack đầy đủ (Prometheus + Grafana + Node Exporter + cAdvisor + Postgres Exporter) cần khoảng 600-800MB RAM theo ước tính thực tế từ self-hosted deployment quy mô nhỏ – con số phụ thuộc vào số metrics scrape (n8n Docs, truy cập 01/07/2026). Nếu VPS của bạn chỉ có 2GB, monitoring stack sẽ chiếm 30-40% RAM, cộng với n8n và PostgreSQL thì sẽ tight. Mình khuyến nghị VPS tối thiểu 4GB RAM khi chạy full stack. Nếu chỉ có 2GB, bắt đầu với Prometheus + Grafana + Node Exporter trước, bỏ cAdvisor và các exporter khác.
Có thể dùng Datadog thay Prometheus không?
Được, Datadog có integration chính thức với Docker và có thể thu thập metrics tương tự. Datadog Agent tự động discover containers, setup nhanh hơn Prometheus. Nhưng Datadog tốn tiền: khoảng $15-23/host/tháng cho infrastructure monitoring (Datadog Pricing, truy cập 01/07/2026). Với n8n self-host trên 1-2 VPS, chi phí này chưa hợp lý. Khi nào team lớn hơn và cần alerting enterprise, compliance, hay APM thì Datadog đáng xem xét. Hiện tại, Prometheus + Grafana là đủ và tiết kiệm hơn nhiều.
Alert qua Telegram setup mất bao lâu?
Khoảng 10-15 phút nếu đã có Grafana chạy. Tạo Telegram bot qua @BotFather mất 2 phút. Thêm Contact Point trong Grafana mất 3 phút. Tạo Notification Policy và test alert mất 5 phút. Phần mất thời gian nhất là viết alert rules PromQL cho đúng, nhưng bạn đã có sẵn template trong bài này. Mình hay khuyên người mới bắt đầu với 3 alert đơn giản nhất trước: n8n down, disk đầy, RAM cao. Ba cái này cover 80% sự cố thực tế.
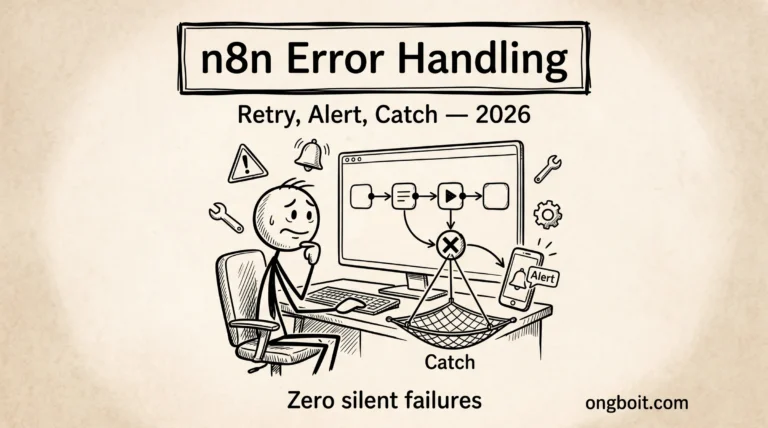
Để bổ sung cho monitoring, hãy đọc thêm hướng dẫn n8n error handling với 3 tầng bảo vệ workflow: Retry on Fail, Error Output Pin và Error Workflow với Telegram alert. Monitoring cho biết hệ thống đang hoạt động thế nào, error handling đảm bảo bạn biết ngay khi có workflow thất bại.
Kết Luận
Monitoring setup mình chia sẻ trong bài này là chính xác những gì mình chạy cho ongboit.com và các dự án client. Total setup time khoảng 30-45 phút nếu bạn follow Docker Compose config ở trên. Sau đó, bạn có visibility hoàn toàn vào n8n stack mà không tốn thêm đồng nào.
Muốn tự động hóa toàn bộ, từ install, backup, đến enable monitoring stack bằng 1 lệnh? n8n-toolkit đã có flag --monitoring làm đúng điều đó, kèm 255 tests để đảm bảo script không break production của bạn (GitHub: thenguyenvn90/n8n-toolkit, truy cập 01/07/2026).
Monitoring không phải là “nice to have” khi chạy n8n production, đó là prerequisite. Bắt đầu từ đâu? Mình khuyên thứ tự này: (1) bật N8N_METRICS=true ngay hôm nay (không cần làm gì thêm), (2) setup Prometheus + Grafana với Docker Compose profiles từ bài này, (3) import 3 dashboard đầu tiên (n8n Essentials, Node Exporter, cAdvisor), (4) tạo 3 alert rules cơ bản và kết nối Telegram.
Toàn bộ setup này mất khoảng 2-3 giờ lần đầu. Sau đó bạn sẽ tiết kiệm được nhiều giờ troubleshooting mỗi khi có sự cố, vì metrics đã sẵn có và bạn biết chính xác lỗi xảy ra lúc nào.
Nếu bạn đang dùng Claude Code để tự động hóa DevOps tasks, bộ công cụ này tích hợp tốt với monitoring stack này. Bạn có thể dùng các MCP servers để query Prometheus metrics trực tiếp trong conversation. Đó là bước tiếp theo mình đang explore.
Nếu bạn chưa có n8n production setup, xem hướng dẫn self-host n8n bằng Docker Compose với Traefik + PostgreSQL trước khi thiết lập monitoring stack này.
Bạn đang monitor n8n theo cách nào? Comment bên dưới để mình biết, và mình sẽ update bài với những metrics thực tế từ cộng đồng.
Đã có monitoring và cần throughput cao hơn? Queue Mode cho phép xử lý nhiều workflow song song đáng kể, và monitoring stack ở trên sẽ hiển thị Queue Backlog metrics ngay khi bạn bật Queue Mode.